
Understanding Key Metrics for Fundamental Analysis: A Beginner's Guide
7 min read · Stock Fusion Academy
Hey there, fellow investors! If you're diving into the world of fundamental analysis to evaluate a company before investing, you're in the right place. Today, we’ll break down some key financial metrics that help you understand a company’s health, value, and potential for growth. These metrics are straight from a real-world example, and I’ll explain each one step-by-step with examples in Indian Rupees (₹) to make things super clear. Let’s get started!
EX.
1. Market Cap (Market Capitalization)
Market Cap tells you the total value of a company in the stock market. It’s calculated by multiplying the current share price by the total number of outstanding shares.
Example: If a company has 10 lakh shares, and each share is priced at ₹100, the Market Cap is 10,00,000 × ₹100 = ₹10 Cr (crores).
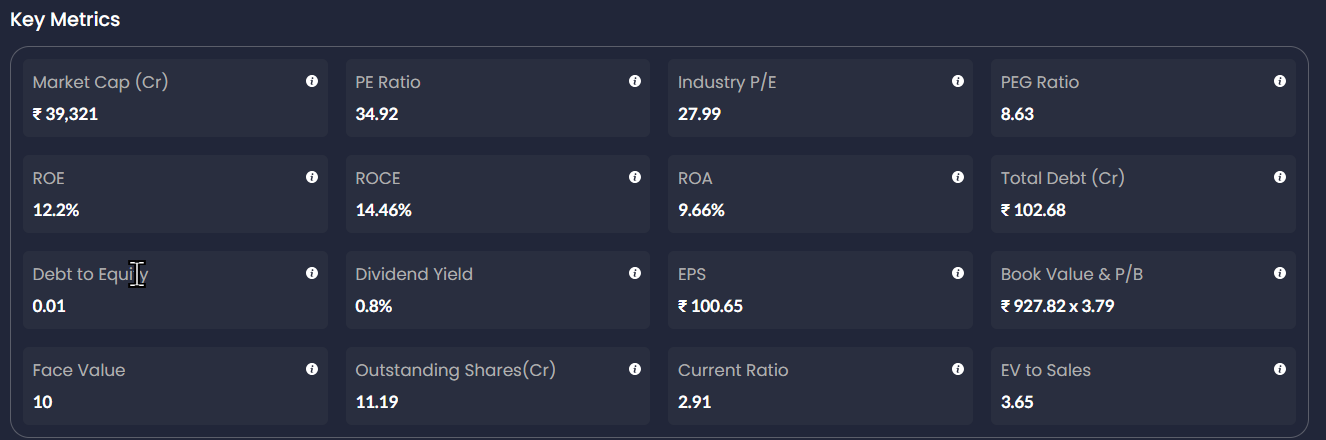
In our case: The Market Cap is ₹39,321 Cr. That’s huge, meaning this is a large-cap company with a significant market presence.
2. PE Ratio (Price-to-Earnings Ratio)
The PE Ratio shows how much investors are willing to pay for each rupee of the company’s earnings. It’s calculated as the share price divided by Earnings Per Share (EPS).
Example: If a share costs ₹100 and the EPS is ₹5, the PE Ratio is 100 ÷ 5 = 20. This means investors are paying ₹20 for every ₹1 of earnings.
In our case: The PE Ratio is 34.92, which is on the higher side. This suggests investors have high expectations for future growth, but it could also mean the stock is overvalued.
3. Industry P/E
This is the average PE Ratio of all companies in the same industry. It helps you compare the company’s PE with the industry standard.
Example: If the Industry P/E is 25 and the company’s P/E is 20, the stock might be undervalued compared to its peers.
In our case: The Industry P/E is 27.99, while the company’s P/E is 34.92. This indicates the stock is trading at a premium compared to the industry average.
4. PEG Ratio (Price/Earnings-to-Growth Ratio)
The PEG Ratio factors in the company’s growth rate. It’s the PE Ratio divided by the expected earnings growth rate. A PEG below 1 is often considered a good deal.
Example: If the PE Ratio is 20 and the earnings growth rate is 10%, the PEG is 20 ÷ 10 = 2. A PEG of 2 means the stock might be overpriced relative to its growth.
In our case: The PEG Ratio is 8.63, which is quite high. This suggests the stock is expensive when factoring in its growth prospects.
5. ROE (Return on Equity)
ROE measures how efficiently a company uses shareholders’ money to generate profit. It’s calculated as Net Income divided by Shareholders’ Equity.
Example: If a company has ₹100 Cr in equity and earns a net income of ₹15 Cr, ROE is (15 ÷ 100) × 100 = 15%.
In our case: ROE is 12.2%, which is decent but not exceptional. It shows the company is generating a reasonable return on shareholders’ funds.
6. ROCE (Return on Capital Employed)
ROCE tells you how well a company uses its total capital (equity + debt) to generate profits. It’s a great measure of overall efficiency.
Example: If a company’s total capital is ₹200 Cr and it earns ₹30 Cr in profit, ROCE is (30 ÷ 200) × 100 = 15%.
In our case: ROCE is 14.46%, which is solid. It indicates the company is making good use of its capital.
7. ROA (Return on Assets)
ROA shows how efficiently a company uses its assets to generate profit. It’s calculated as Net Income divided by Total Assets.
Example: If a company has ₹500 Cr in assets and earns ₹50 Cr in profit, ROA is (50 ÷ 500) × 100 = 10%.
In our case: ROA is 9.66%, which is good. It means the company is effectively using its assets to generate earnings.
8. Total Debt
This is the total amount of debt the company owes. It’s a key metric to assess financial risk.
Example: If a company has borrowed ₹50 Cr from banks, that’s its total debt.
In our case: The Total Debt is ₹102.68 Cr. While this seems like a lot, it’s relatively low compared to the company’s Market Cap of ₹39,321 Cr, so the debt burden isn’t too heavy.
9. Debt to Equity Ratio
This ratio compares a company’s debt to its equity, showing how much debt is used to finance the company compared to shareholders’ funds.
Example: If a company has ₹50 Cr in debt and ₹100 Cr in equity, the Debt to Equity Ratio is 50 ÷ 100 = 0.5.
In our case: The Debt to Equity Ratio is 0.01, which is extremely low. This is a great sign, as it means the company is mostly funded by equity and has minimal debt risk.
10. Dividend Yield
Dividend Yield shows the percentage of the share price that the company pays out as dividends. It’s a key metric for income-focused investors.
Example: If a share costs ₹100 and the annual dividend is ₹2, the Dividend Yield is (2 ÷ 100) × 100 = 2%.
In our case: The Dividend Yield is 0.8%, which is low. This company isn’t focused on paying high dividends, likely because it’s reinvesting profits for growth.
11. EPS (Earnings Per Share)
EPS tells you how much profit a company makes per share. It’s calculated as Net Income divided by the number of outstanding shares.
Example: If a company earns ₹10 Cr in profit and has 10 lakh shares, EPS is 10,00,00,000 ÷ 10,00,000 = ₹100.
In our case: EPS is ₹100.65, which is strong. It shows the company is highly profitable on a per-share basis.
12. Book Value & P/B Ratio (Price-to-Book Ratio)
Book Value is the net asset value per share, while P/B Ratio compares the share price to the Book Value.
Example: If the Book Value per share is ₹50 and the share price is ₹150, the P/B Ratio is 150 ÷ 50 = 3.
In our case: The Book Value is ₹927.82, and the P/B Ratio is 3.79. This means the stock is trading at 3.79 times its Book Value, which is on the higher side, indicating the market has high expectations.
13. Face Value
Face Value is the nominal value of a share as set by the company when it’s issued.
Example: If a company sets the Face Value at ₹10, that’s the base value of the share, though the market price will usually be higher.
In our case: The Face Value is ₹10, which is typical for many companies.
14. Outstanding Shares
This is the total number of shares available in the market.
Example: If a company has 10 lakh shares in the market, those are its outstanding shares.
In our case: There are 11.119 Cr outstanding shares, which is a large number, typical for a company with a high Market Cap.
15. Current Ratio
The Current Ratio measures a company’s ability to pay its short-term liabilities with its short-term assets.
Example: If a company has ₹200 Cr in current assets and ₹100 Cr in current liabilities, the Current Ratio is 200 ÷ 100 = 2.
In our case: The Current Ratio is 2.91, which is excellent. It shows the company has nearly 3 times more assets than liabilities, indicating strong financial health.
16. EV to Sales (Enterprise Value to Sales)
EV to Sales compares the company’s Enterprise Value (Market Cap + Debt - Cash) to its annual sales. It’s a good measure of how the market values the company’s revenue.
Example: If a company’s Enterprise Value is ₹500 Cr and its sales are ₹100 Cr, the EV to Sales is 500 ÷ 100 = 5.
In our case: The EV to Sales is 3.65, which is reasonable. It shows the company is valued at 3.65 times its sales, a fair valuation depending on the industry.
How to Use These Metrics for Investing?
Now that you understand these metrics, here’s how to apply them:
Compare with Industry Standards: Check the company’s PE, ROE, and ROCE against the industry average to see if it’s performing better or worse.
Assess Debt Levels: Look at the Debt to Equity Ratio and Total Debt to ensure the company isn’t over-leveraged.
Evaluate Growth Potential: Use the PEG Ratio to see if the stock’s price aligns with its growth prospects.
Check Profitability and Stability: Metrics like EPS, ROA, and Current Ratio help you gauge how profitable and financially stable the company is.